ExposeBox
ExposeBox
ExposeBox delivers a smart growth marketing solution that allows its users to save time and money without the need to juggle multiple platforms and patched-up solutions.
ExposeBox delivers a smart growth marketing solution that allows its users to save time and money without the need to juggle multiple platforms and patched-up solutions.
My role
UX - UI - Product
Year
2020
My role
UX - UI - Product
Year
2020
VIBE
Vibe is a dashboard generator, creating customize dashboards per user's need.
the clients are the major telco companies and big data organization.
My role
UX
Year
2015
VIBE
Vibe is a dashboard generator, creating customize dashboards per user's need.
the clients are the major telco companies and big data organization.
My role
UX
Year
2015
VIBE
Vibe is a dashboard generator, creating customize dashboards per user's need.
the clients are the major telco companies and big data organization.
My role
UX
Year
2015
VIBE
Vibe is a dashboard generator, creating customize dashboards per user's need.
the clients are the major telco companies and big data organization.
My role
UX
Year
2015
Social media dashboard
A social management tool to coordinate brand social presence across multiple channels and accounts in one single interface.
My role
Concept
Year
2018
Social media dashboard
A social management tool to coordinate brand social presence across multiple channels and accounts in one single interface.
My role
Concept
Year
2018
ExposeBox
ExposeBox delivers a smart growth marketing solution that allows its users to save time and money without the need to juggle multiple platforms and patched-up solutions.
My role
UX - UI - Product
Year
2020
Wirex
The struggle with a lack of context, ineffective tools and even the skills to properly investigate are at the heart of the problem in security investigations. Once a potential incident has been identified, WireX quickly provides you the necessary intelligence to take action
My role
UX - UI - Product
Year
2017-8
Virtual Wallet
On-line wallet for virtual coins, this project was part of a POC made for a crypto start-up. they wanted to create simple fast and slick virtual wallet where all necessary actions are easy and accessible
My role
UX - UI - Product
Year
2019
Wenspire
Wenspire uses the power of AI and Information Theory to provide companies with the first API security and analytics platform. Acting like a powerful and fully-automated x-ray machine in the background, Wenspire’s platform continuously maps all APIs used by a company and analyzes API communication to discover anomalies and threats and provide insights.
My role
UX - UI - Product
Year
2019
Wirex
The struggle with a lack of context, ineffective tools and even the skills to properly investigate are at the heart of the problem in security investigations. Once a potential incident has been identified, WireX quickly provides you the necessary intelligence to take action
My role
UX - UI - Product
Year
2017-8
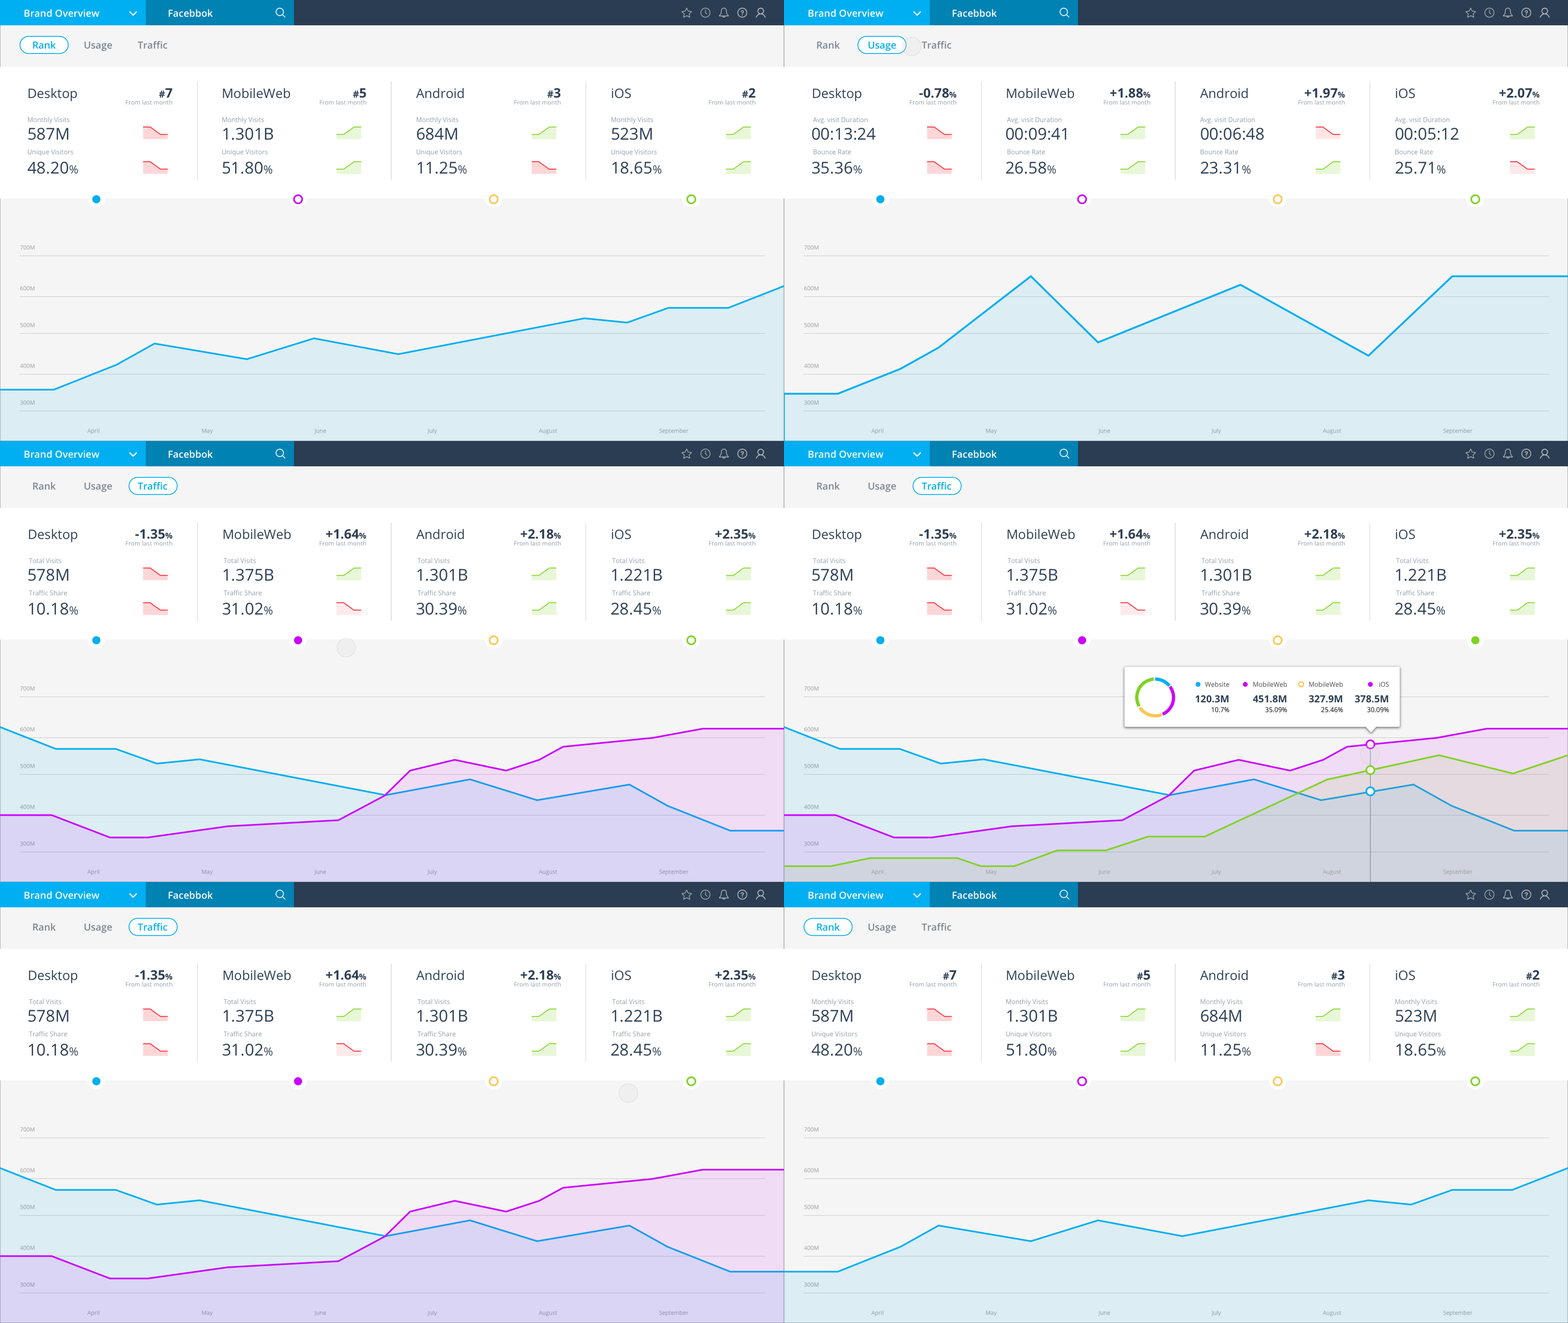
Website traffic
Comparison between different type of website behavior data: Usage, Traffic, Rank
in every platform (Desktop, MobileWeb, Android, iOS)
My role
Concept
Year
2016
2016

Step 01 - Brand behavior as KPIs
After collecting all relevant data about brand behavior in all websites & apps, the first challenge was to find a way how to group the information into one dashboard
+
Website behavior
Total Visits
Traffic Share
Rank (global, country, category)
Monthly visits
Monthly unique visitors
Avg. visits duration
Page per visits
Bounce rate
Apps behavior
Current installs
Active users
Usage time
US/Shopping rank
Usage pattern
Retention
Step 02 - Finding the KPIs common denominator
Play with the data, create groups and organize it according to the users' interests
Traffic Share = Platform Visits / Total Visits
Avg. Visit Duration = Total Visits / Usage Time
Rank = Current Instals / App Active Users
Step 03 - Organize the KPIs in a ledgend
Organize the KPIs into groups that make sense, the user doesn't need to see all of them all the time
Total Visits
Traffic Share
Monthly visits
Monthly unique visitors
installs
Active users
Traffic
Usage
Avg. visits duration
Page per visits
Bounce rate
Usage time
Usage pattern Retention
Rank
Rank (global, category) US/Shopping rank

